

Categories
Market updates, ComparisonsPublished October 6, 2026
October Las Vegas Housing Market Update: Is the Market Finally Cooling? What September 2026 Data Reveals

October Las Vegas Housing Market Update: Is the Market Finally Cooling? What September 2026 Data Reveals
Something has shifted across the Las Vegas Valley.
Open houses are quieter. For-sale signs are lingering longer on neighborhood corners. Daily price-drop notifications are buzzing on buyer smartphones. Conforming mortgage rates recently climbed past 7.2%.
To anyone browsing local listings, it feels like the Southern Nevada housing market is finally hitting the brakes.
Yet when the official numbers arrived, they revealed a striking contradiction.
According to the latest Las Vegas REALTORS® September 2026 market report, the median price of an existing single-family home sold across Southern Nevada in September 2026 was exactly $470,000. That is precisely where the median resale price stood in September 2025—a flat 0.0% change year over year.
How can open houses be so quiet and inventory climb toward multi-year highs while single-family home prices refuse to budge?
Is the Las Vegas housing market actually cooling down, or are we witnessing rate-driven normalization after years of sharp volatility?
To understand what is truly happening on the ground, we have to look past the surface headlines and examine the verified figures shaping Southern Nevada real estate this autumn.
What September 2026 Data Reveals About the Southern Nevada Housing Market
Evaluating the health of the Las Vegas housing market requires separating seasonal rhythm from structural change.
Completed statistics for September 2026 from Las Vegas REALTORS® (LVR) show a market functioning under clear borrowing headwinds. LVR tracks existing residential transactions across Clark County and the greater Las Vegas Valley through the local Multiple Listing Service (MLS).
These figures reflect completed transactions closed during the month of September, offering the most comprehensive baseline available for October evaluation.
The Core September Numbers at a Glance
The single-family resale median price settled at $470,000 in September. That represents a modest 1.1% decline from August's median of $475,000, but remains identical to the $470,000 mark recorded twelve months earlier.
Attached properties showed more pronounced downward movement. The median price for local condominiums and townhomes fell to $290,000 in September, dropping 3.3% from August ($300,000) and 1.4% compared to September 2025 ($294,000).
Meanwhile, active listing inventory continued to accumulate across the Valley. Single-family homes listed without offers reached 7,995 at the end of September. That marks a 5.3% increase from August and a 6.6% increase compared to September 2025.
Total monthly sales volume pulled back alongside rising listings. Southern Nevada recorded 2,169 closed resale transactions across all property types in September, slipping 3.7% from August. Single-family closings fell 7.4% year over year, while condo and townhome closings dropped 12.6%.
Based on September's closing pace, available housing inventory stood at approximately 5.0 months of supply.
September 2025 vs. September 2026 Market Comparison
Southern Nevada Existing Residential Housing Resale Statistics (Las Vegas REALTORS®)
$470,000
SF Median Price (0.0% YoY)
7,995
SF Active Inventory (+6.6% YoY)
2,169
Total Closed Resales (-3.7% MoM)
5.0 Mos
Available Housing Supply
→ Scroll table horizontally to view full metrics
| Market Metric | Sept. 2026 | Aug. 2026 | Sept. 2025 | MoM Change | YoY Change | Market Signal |
|---|---|---|---|---|---|---|
| Single-Family Median Price | $470,000 | $475,000 | $470,000 | -1.1% | 0.0% | Price Stabilized |
| Condo/Townhome Median Price | $290,000 | $300,000 | $294,000* | -3.3% | -1.4% | Price Softness |
| Single-Family Closed Sales | 1,755 | 1,814 | 1,914 | -3.3% | -7.4% | Slower Volume |
| Condo/Townhome Closed Sales | 426 | 450 | 495 | -5.3% | -12.6% | Contracted Volume |
| Total Completed Resale Transactions | 2,169 | 2,252 | 1,992 | -3.7% | -9.7% | Seasonal Ease |
| Single-Family Active Inventory (No Offers) | 7,995 | 7,590 | 7,500* | +5.3% | +6.6% | Expanded Choice |
| Months of Housing Supply | 5.0 mos | 4.5–4.7 mos | ~4.0 mos | +0.4 mos | +1.0 mos | Balanced Market |
While these baseline metrics depict an orderly market, looking at where prices sit relative to their historical peaks reveals where pricing pressure is actually concentrating.
For historical context, see our previous Las Vegas housing market updates.
Are Las Vegas Home Prices Actually Falling?
Whether Las Vegas home prices are "falling" depends entirely on the yardstick you use.
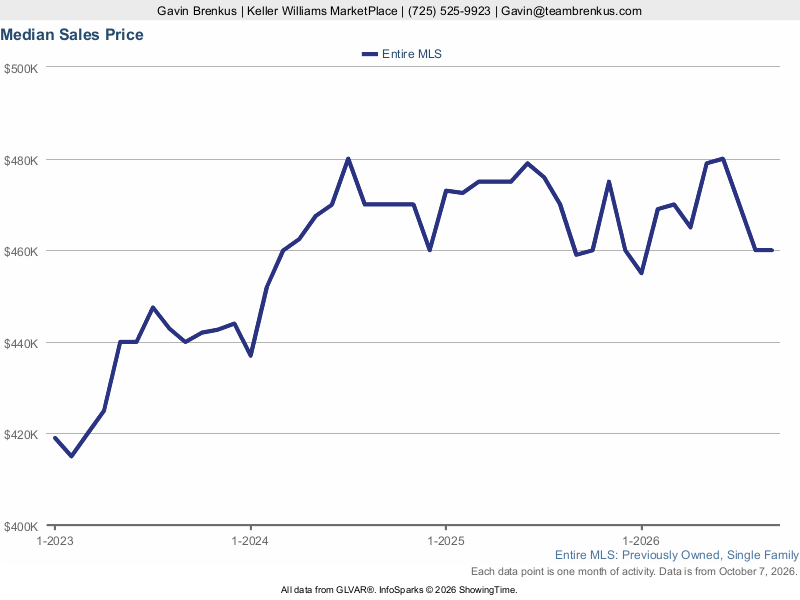
Compared to one year ago, single-family prices are not falling. They are perfectly flat. However, compared to the peak pricing reached earlier in the summer, values have experienced measurable softening.
Understanding this distinction helps explain why buyers and sellers often perceive the market so differently today.
Single-Family Prices Have Eased From the Peak—But Remain Flat Year Over Year
During May and June of 2026, the median resale price for single-family homes in Southern Nevada reached an all-time record peak of $490,000.
From that summer high-water mark, September's median of $470,000 represents a pullback of $20,000, or a peak-to-trough decline of approximately 4.08%.
$490,000 (May/June Peak) ──> $475,000 (August) ──> $470,000 (September)
Net Peak Deviation: -$20,000 (-4.08%) | Net Year-to-Date Change: 0.0%
A 4% seasonal pullback from a summer peak is standard in Southern Nevada real estate history. In fact, the median single-family price began 2026 at $470,000 in January, climbed during the spring buying wave, and settled right back at $470,000 by September.
In technical terms, this does not meet the definition of a market correction, which typically requires a sustained 10% or greater downward repricing. Rather, it reflects price plateauing and seasonal plateauing after peak activity.
Condos and Townhomes Are Showing More Price Softness
While detached single-family homes have demonstrated price resilience, attached condominiums and townhomes tell a slightly softer story.
The median condo and townhome sales price fell to $290,000 in September. That is 7.94% below the all-time peak of $315,000 recorded in October 2024, representing a $25,000 value reduction.
Several distinct market dynamics appear to be exerting heavier pressure on the attached market:
- Entry-Level Rate Sensitivity: Condo and townhome buyers are frequently first-time purchasers who are disproportionately vulnerable to elevated mortgage interest rates.
- Escalating Association Fees: Rising community association dues and deferred maintenance assessments across older Valley complexes increase total monthly housing costs, shrinking the purchase loan balance buyers can qualify for.
- Insurance and Underwriting Friction: Tighter secondary-market guidelines on attached condominium projects have added underwriting complexity for conventional financing.
Buyers exploring attached properties can learn more by exploring their options here: : buying a condo or townhome in Las Vegas.
Prices for detached homes may be maintaining their ground year over year, but the balance of power during escrow negotiations depends heavily on the total number of properties competing for attention.
The Metric That May Matter More Than Price: Las Vegas Housing Inventory
If you want to understand the true pulse of the Las Vegas real estate market, look at available inventory rather than sales prices.
When active listings are scarce, sellers retain strong pricing leverage regardless of mortgage rates. But when active inventory expands steadily, buyers gain the luxury of comparison, patience, and negotiating room.
Throughout 2026, inventory accumulation has been the most consistent structural trend across the Las Vegas Valley.
Single-Family Active Listings Reached 7,995
According to Las Vegas REALTORS® MLS data, there were 7,995 single-family homes listed for sale without pending offers at the end of September.
This inventory count represents a 5.3% jump from August (7,594 listings) and a 6.6% increase compared to September 2025 (7,500 listings). For attached properties, active listings without offers climbed to 2,796 units, a 7.3% increase year over year.
Single-family active listings have climbed out of the historically constrained 3,500-to-5,000 range seen during 2021 and 2022. Southern Nevada buyers now have the widest selection of resale homes to tour since late 2019.
Active Single-Family Inventory Growth During 2026
Southern Nevada Resale Listings Without Offers (Las Vegas REALTORS® MLS Data)
7,995
Sept 2026 Listings (Peak)
+5.3%
Month-over-Month Growth
+6.6%
Year-over-Year Increase
+28.9%
Expansion Since Jan 2026
What 5 Months of Housing Supply Actually Means
Inventory is best interpreted through the metric of available housing supply. Months of supply measures how long existing inventory would last at the current pace of monthly sales if no new listings entered the market.
At the end of September 2026, Southern Nevada sat at approximately 5.0 months of supply.
    [Under 4.0 Months]        [4.0 to 6.0 Months]        [Over 6.0 Months]
     Seller's Market           Balanced Market            Buyer's Market
                          ▲ (Current LV: 5.0 Mos)
In traditional real estate economics, a balanced market sits between 4.0 and 6.0 months of available inventory:
- Less than 4 months indicates a seller-advantaged market with intense competition.
- Greater than 6 months indicates a buyer-dominated market characterized by surplus supply.
- A 5.0-month supply represents a balanced market equilibrium.
Reaching 5.0 months does not mean Las Vegas has abruptly tipped into a severe buyer's market. What it confirms is the complete unwinding of the extreme seller advantage that defined the post-2020 landscape.
Buyers have meaningful choices, but homes are still changing hands steadily across the Valley.
Fewer Las Vegas Homes Are Selling—But They're Not All Sitting
Rising inventory naturally prompts a logical question: Are transactions grinding to a halt?
Local reporting by the Southern Nevada home prices and inventory analysis highlighted a clear pullback in monthly closings. Yet a closer examination of sales velocity reveals that properly positioned properties are still securing escrows in reasonable timeframes.
Closed Sales Have Declined
Southern Nevada recorded 2,169 total completed resale transactions in September 2026. This reflects a 3.7% month-over-month decline from August's 2,252 sales.
When analyzed by property classification against last year's figures, the volume slowdown is evident:
- Single-family home closings dropped approximately 7.4% year over year.
- Condo and townhome transactions declined approximately 12.6% year over year.
This transaction contraction confirms that market activity has cooled. Prospective buyers are hesitating, taking longer to make purchasing decisions, or finding themselves sidelined by borrowing qualification challenges.
However, lower sales volume alone does not equate to a collapsing housing market.
Many Successful Sales Still Close Within 60 Days
Despite declining total closings, market velocity for well-positioned homes remains surprisingly steady.
According to Las Vegas REALTORS® resale data, 75.9% of all single-family homes that successfully closed in September sold within 60 days of being listed.
The Velocity Reality — 75.9% of Successful Single-Family Closings Sold Within 60 Days
The market has certainly shifted away from the frantic 2021 period when listings routinely attracted sight-unseen bidding wars within 72 hours. Homes require more marketing exposure today.
Nevertheless, three out of every four properties that cross the finish line find an escrow contract within two months.
Homes are not sitting indefinitely across the board. The market is rewarding listings that meet current buyer expectations on price, condition, and presentation, while punishing listings that ignore shifting dynamics.
To understand why overall sales volume has tapered while prices hold firm, one must look directly at the price of financing.
Why Mortgage Rates May Explain the Market Better Than Home Prices
Home prices alone do not dictate consumer behavior. The true determinant of demand in Southern Nevada is monthly carrying cost.
Throughout 2026, benchmark borrowing costs have acted as a financial brake on transaction volume, creating friction for buyers and locking existing homeowners into their current low-rate mortgages.
The Move From 6.06% to 7.28%
According to the Freddie Mac Primary Mortgage Market Survey, the national benchmark 30-year fixed-rate mortgage reached 7.28% as of October 1, 2026.
To put that benchmark into perspective, review the multi-month trajectory tracked by historical 30-year fixed mortgage rates:
- January 15, 2026: 6.06%
- September 24, 2026: 7.03%
- October 1, 2026: 7.28% (Early-October Indicator)
Rates hovered near 6% early in the year, sparking a burst of spring activity that propelled the single-family median to its $490,000 June peak.
As benchmark yields pushed past 7% in late September and reached 7.28% in early October, the cost of financing tightened. This dynamic reduced the maximum mortgage balance for which local wage earners could qualify.
What That Rate Change Does to an Illustrative Monthly Payment
To see how interest rate fluctuations alter purchasing power without any change in purchase price, consider this illustrative scenario based on the September median single-family price of $470,000.
Assume a buyer purchases a home at $470,000 with a 20% down payment ($94,000), financing the remaining loan balance of $376,000 on a 30-year fixed mortgage:
- At 6.06% (January 2026 Benchmark):
- Principal and Interest Payment: $2,268.83 per month
- At 7.28% (October 1, 2026 Benchmark):
- Principal and Interest Payment: $2,572.64 per month
- Monthly Debt-Service Difference: +$303.81 per month (+$3,645.72 annually)
$470,000 Purchase Price (20% Down / $376,000 Loan)
Jan 2026 @ 6.06%:  $2,268.83/mo P&I
Oct 2026 @ 7.28%:  $2,572.64/mo P&I ──> +$303.81/mo (+13.4% Debt Service Cost)
Illustrative Monthly Payment Comparison — Principal & Interest Only
Note: This is an illustrative principal-and-interest calculation only. It does not include property taxes, homeowners insurance, HOA fees, mortgage insurance, closing costs, or utilities, and does not represent an individual loan quote.
A $303 monthly payment increase represents a 13.4% rise in debt service for the identical physical property.
This financial hurdle explains why buyer volume has slowed and why inventory is accumulating. The market slowdown is driven primarily by mortgage friction, not an organic disappearance of demand or an oversupply of physical housing.
Are Las Vegas Buyers Finally Gaining Negotiating Power?
With inventory reaching 7,995 homes and mortgage rates above 7%, consumer dynamics have fundamentally changed.
Buyers touring homes today are no longer subjected to multiple-offer lotteries or pressured into waiving appraisal and financing contingencies.
However, prospective purchasers must navigate an important distinction: negotiating power does not automatically equal overall affordability.
Price Reductions Are More Common
Because active listings are accumulating, sellers who launch at aspirational price points are frequently forced to recalibrate.
According to a regional MLS inventory and price reduction analysis tracking Southern Nevada resale listings:
- Approximately 42.4% of active listings had experienced at least one price reduction as of late September.
- The median price reduction among discounted properties was approximately $20,000.
- Closed sale-to-final-list price ratios averaged between 98.8% and 98.9%.
- Approximately 57.6% to 59.0% of settled transactions closed below the seller's original asking price.
These figures illustrate that sellers are increasingly willing to negotiate to secure a closing. Appraisals are scrutinized, inspection repair requests are taken seriously, and closing credits are widely discussed during contract negotiations.
Review practical purchasing strategies in our guide: buying a home in Las Vegas.
More Leverage Does Not Automatically Mean Better Affordability
While negotiating conditions have shifted in favor of buyers, overall affordability remains constrained by interest rates.
More Negotiating Power ≠ Better Affordability
A buyer may successfully negotiate $15,000 off a seller's asking price or secure a $10,000 closing credit. Yet at a 7.28% benchmark interest rate, that buyer's monthly mortgage obligation will still exceed what the same home would have cost at 6% with no seller discount whatsoever.
For this reason, forward-thinking buyers are increasingly directing their negotiating power toward financing incentives rather than straight price reductions.
Requesting seller credits to fund temporary mortgage buydowns (such as a 2-1 buydown) can reduce the effective borrowing rate to 5.28% in year one. That approach directly targets borrowing friction and lowers initial monthly payments.
Learn how to structure these requests in our guide to seller concessions.
What Rising Inventory Means for Las Vegas Home Sellers
For Southern Nevada homeowners considering a sale in late 2026, the era of "testing the market" with an inflated launch price has ended.
With nearly 8,000 single-family properties competing for buyer attention, listings that fail to present immediate, compelling value are passed over in favor of better-priced alternatives.
Successfully selling in a 5.0-month supply environment requires a disciplined, data-driven approach.
What Las Vegas Sellers Should Watch in a More Competitive Market
Pricing Expectations Matter More When Buyers Have Options
With 42.4% of active Valley listings undergoing price cuts, entering the MLS above current comparable sales carries significant risks.
When a home sits on the market past the initial 21-to-30-day marketing window, buyer perception shifts. Inquiries dwindle, showings taper off, and prospective buyers assume the property has underlying defects or an uncooperative seller.
Subsequent price cuts often net a seller less proceeds than a clean, accurate launch price would have captured during week one.
Explore our tactical guide on pricing a Las Vegas home.
Presentation, Condition, Marketing, and Concessions
Because buyers have more properties to tour, home condition and visual appeal carry renewed weight.
Turnkey properties that are properly staged, professionally photographed, and impeccably maintained represent the bulk of the 75.9% of homes selling within 60 days. Listings requiring deferred maintenance or design updates are either discounted heavily or left on the shelf.
Furthermore, sellers must be prepared to negotiate terms that matter to today's rate-constrained purchasers:
- Offering a seller-paid concession to buy down the buyer's interest rate.
- Contributing toward permanent mortgage discount points.
- Providing home warranties and addressing reasonable repair items noted during physical inspections.
Assisting a buyer with their financing costs is often far more cost-effective for a seller than executing repeated, reactive $10,000 price drops.
New Construction Is Creating Another Kind of Competition
Resale sellers in Southern Nevada are not just competing against neighboring existing homes; they are also competing against production home builders.
From master-planned communities in Summerlin and Cadence to developing enclaves across Henderson and the southwest Valley, builders are actively adjusting to market friction.
Understanding builder dynamics provides valuable context, but these figures must be evaluated independently from the resale market.
Builder Sales and Permit Activity Have Slowed
According to Southern Nevada new-home sales and permit data compiling Home Builders Research (HBR) figures:
- Production builders recorded 502 net sales in August 2026, a 31% decline year over year.
- Residential building permits contracted to 448, also down 31% compared to August 2025.
- The median closing price for a newly built home reached $552,990, up 3.1% year over year.
The new-home median price ($552,990) cannot be compared directly with the resale single-family median ($470,000). New construction represents a different product mix, incorporating modern building codes, builder warranty packages, and specific lot premiums.
Resale vs. New Construction — Separate Markets, Different Incentives
Comparing Southern Nevada Resale (LVR September 2026) & New Home Builder Data (HBR August 2026)
$552,990
New Build Median (+3.1% YoY)
502
August Builder Net Sales (-31% YoY)
448
August Building Permits (-31% YoY)
3.99%–4.99%
Builder Subsidized Rate Buydowns
→ Scroll table horizontally to view full market breakdown
| Market Dimension | MLS Resale Housing (LVR) | New Construction Builders (HBR) | Key Strategic Difference |
|---|---|---|---|
| Primary Source Dataset | Las Vegas REALTORS® MLS | Home Builders Research (HBR) | Resale tracks existing homes via MLS; builder data compiles public deeds, permits & division filings. |
| Median Closing Price | $470,000 (SF Resale, Sept) | $552,990 (New Home, Aug) | $82,990 (+17.7%) premium reflecting new master-plan product mix, warranties & lot premiums. |
| Year-over-Year Price Trend | 0.0% (Flat vs. Sept 2025) | +3.1% (vs. August 2025) | New build median rose due to high-end sales mix (Summerlin/Cadence), while resale prices stabilized. |
| Recent Sales Activity | 2,169 (Resale Closings, Sept) | 502 (Builder Net Sales, Aug) | Builder net sales dropped 31% YoY; single-family resale closings pulled back 7.4% YoY. |
| Supply / Pipeline Indicator | 7,995 listings (5.0 mos supply) | 448 permits (-31% YoY in Aug) | Resale inventory is accumulating, while production builders cut permits by 31% to avoid future oversupply. |
| Primary Buyer Financing Incentives | 1%–3% closing credits or negotiated 2-1 buydowns | Permanent rate buydowns (3.99%–4.99%) & $10k–$35k credits | Builders utilize forward rate commitments to offer below-market rates, creating direct competition for resale sellers. |
Financing Incentives Can Compete With Resale Homes
Despite higher base prices, home builders hold a distinct structural advantage over individual resale sellers: in-house mortgage financing.
To keep assembly lines moving and clear spec home standing inventory, national and regional builders regularly deploy mortgage subsidiaries to offer aggressive financing subsidies.
During late summer and early autumn 2026, promotional builder financing packages featured temporary or permanent fixed rates ranging from 3.99% to 5.5% on select inventory homes.
When an entry-level buyer compares a resale home at $470,000 carrying a market rate of 7.28% against a brand-new home priced at $510,000 featuring a builder-subsidized 4.99% rate, the monthly payment on the newly built home can be comparable or even lower.
This dynamic pulls rate-sensitive buyers away from resale stock, providing another reason resale inventory has expanded toward 8,000 listings.
Compare the advantages of both property types when you ask about new construction vs resale homes.
Is the Las Vegas Housing Market Heading Toward a Crash?
As active listings climb, sales slow, and price cuts capture headlines, it is natural for consumers to wonder if Southern Nevada real estate is teetering on the edge of a downturn.
Memories of the 2008 Great Financial Crisis linger in the Las Vegas Valley. During that downturn, single-family prices dropped by more than 50% under an avalanche of foreclosures and short sales.
However, verified September 2026 data shows that today's market fundamentals bear no resemblance to the structural collapse of 2008.
Cooling vs. Crash — What the Data Actually Shows
Distressed Sales Remain Low
The defining characteristic of an outright housing crash is forced systemic liquidation—homeowners compelled to abandon properties through foreclosure or distressed short sales due to underwater equity.
According to Las Vegas REALTORS® September 2026 data:
- Short sales and foreclosures combined accounted for only 1.1% of all resale transactions.
- 98.9% of all completed transactions were traditional, non-distressed sales.
       September 2026 Resale Transactions:
       ┌────────────────────────────────────────────────────────┐
       │ Traditional Non-Distressed Sales: 98.9%                │
       └────────────────────────────────────────────────────────┘
       ▲ Distressed (Foreclosures & Short Sales): 1.1%
During the depth of the 2008–2010 crisis, distressed transactions represented over 60% of total Valley sales. Today, distress is virtually invisible in the MLS data.
Slower Does Not Mean Systemic Distress
Beyond minimal distressed inventory, the market is anchored by liquidity and homeowner equity cushions.
LVR reported that 23.5% of all September resale purchases were completed entirely in cash. Nearly one in every four transactions bypassed mortgage financing altogether, insulating a meaningful portion of the market from rate volatility.
Furthermore, years of home price appreciation have provided homeowners with substantial equity. Borrowers who purchased or refinanced prior to 2023 hold fixed mortgage rates between 3% and 5%, giving them minimal incentive to panic-sell or walk away from their obligations.
A cooling market characterized by lower sales volume and pricing stabilization is an expected economic adjustment to higher borrowing costs. It is not an indicator of systemic market distress.
So, Is the Las Vegas Housing Market Finally Cooling?
When evaluating whether the Las Vegas housing market is "cooling," the answer depends on which specific indicators you measure.
Classifying a complex metropolitan market under a single label oversimplifies reality. A balanced evaluation requires weighing the cooling indicators against the stabilizing factors.
What Supports the Cooling Argument
- Sales Volume Has Contracted: Total resale transactions fell 3.7% month over month, with single-family closings down 7.4% year over year.
- Available Supply Has Expanded: Single-family active listings climbed 6.6% year over year to 7,995 homes, pushing supply to 5.0 months.
- Price Cuts Are Widespread: Secondary MLS tracking indicates 42.4% of active listings have reduced prices, with a median discount of $20,000.
- Borrowing Friction Has Intensified: Benchmark 30-year fixed mortgage rates touched 7.28% on October 1, constraining buyer purchasing power.
What Supports Normalization and Stabilization
- Resale Prices Remain Stable: The single-family median price of $470,000 was completely flat (0.0% change) compared to September 2025.
- Peak Deviation Reflects Normal Seasonality: Detached home prices sit just 4.08% below their June peak, matching standard late-summer price easing.
- Turnover Velocity Remains Intact: 75.9% of successfully closed single-family homes found escrow contracts within 60 days.
- Systemic Distress Is Absent: Foreclosures and short sales accounted for just 1.1% of completed transactions.
Las Vegas Housing Market Cooling Evidence Scorecard
Evaluating September 2026 Resale Metrics: Cooling vs. Normalization & Price Stabilization
6 Indicators
Support Cooling Thesis
3 Indicators
Contradict Cooling (Stabilized)
2 Indicators
Mixed / Neutral Balance
$470,000
SF Median Price (0.0% YoY)
→ Scroll table horizontally to view complete scorecard
| Market Indicator | September 2026 Evidence | Comparison Benchmarks | Analytical Interpretation | Supports Cooling? |
|---|---|---|---|---|
| Single-Family Home Prices | Median: $470,000 | -1.1% MoM; 0.0% YoY; -4.08% from 2026 peak ($490k) | Detached resale prices remain identical year-over-year, reflecting price stabilization rather than correction. | No |
| Condo & Townhome Prices | Median: $290,000 | -3.3% MoM; -1.4% YoY; -7.94% from peak ($315k) | Attached properties show persistent price erosion driven by escalating HOA fees and stricter lending rules. | Yes |
| Closed Sales Volume | 2,169 total completed resales | -3.7% MoM; -7.4% SF YoY; -12.6% Condo YoY | Transaction volume remains constrained as elevated interest rates restrict overall market absorption. | Yes |
| Active Listing Inventory | 7,995 SF listings without offers | +5.3% MoM; +6.6% YoY ( highest level since 2020 ) | Inventory accumulation has significantly broadened home buyer choices across the Valley. | Yes |
| Months of Housing Supply | 5.0 months of supply | Up from 4.5–4.7 mos in Aug 2026; ~4.0 mos in Sept 2025 | Supply reached the exact midpoint of historical balance ( 5.0 mos ), reflecting equilibrium rather than distress. | Mixed |
| Market Speed / Velocity | 75.9% of SF closings sold in ≤ 60 days | Up from 72.0% SF and 67.0% Condo in Sept 2025 | Properties that successfully close continue to move quickly, resisting a systemic slowdown in transaction speed. | No |
| Price Reductions | 42.4% active price cut share | Median discount: $20,000 (3.9% off initial list price) | Widespread listing discounts reflect pricing friction between ambitious sellers and rate-sensitive buyers. | Yes |
| Pending Sales Ratio | 2,362 valley pending contracts | 4.8 active listings per pending contract | Contract absorption has slowed relative to expanding active inventory, giving buyers increased leverage. | Yes |
| Seller Concessions | 1% to 3% closing cost credits common | Up significantly from minimal concessions in 2021–2023 | Sellers are routinely offering financial credits to buy down buyer mortgage rates and defend headline values. | Mixed |
| Mortgage Interest Rates | 7.28% benchmark 30-yr fixed (Oct 1) | Up from 6.66% late Aug 2026 and 6.06% in Jan 2026 | Rising borrowing costs directly suppress buyer purchasing power and slow sales velocity across all tiers. | Yes |
| Distressed Sales Share | 1.1% of total transactions | Historical norm <1.5%; 2009 peak >60% | Near-record low distress confirms home equity stability and the complete absence of forced liquidations. | No |
The Best-Supported Conclusion
Taking the full body of evidence into account, the Southern Nevada housing market is best characterized as experiencing:
Rate-driven normalization and price stabilization within a balanced, seasonally slowing market.
The market is unquestionably cooler than it was during the peak spring months of 2026, and significantly more subdued than the distorted, hyper-competitive conditions of 2021.
However, calling this market a "crash" or "major correction" contradicts the verified numbers.
Higher mortgage rates have effectively reined in demand and softened transaction velocity. Concurrently, low distressed supply and homeowner equity have prevented prices from tumbling.
The Las Vegas market is not collapsing; it is finding equilibrium in a 7% interest rate world.
What Buyers and Sellers Should Watch Through the Rest of 2026
As Southern Nevada transitions through the fourth quarter of 2026, several key indicators will determine where the market heads next.
What to Watch Through the Rest of 2026
Rather than relying on speculative forecasts, market participants should track these leading data points:
- Active Inventory Crossing the 8,500 Threshold: If single-family listings push past 8,500 units without a corresponding rebound in closed sales, available supply could cross 5.5 to 6.0 months, tilting the market more decisively toward buyers.
- Mortgage Rate Direction: Whether benchmark 30-year fixed rates stabilize near 7% or drift higher will dictate fourth-quarter buyer qualification and escrow volume.
- The 60-Day Sales Velocity Metric: If the percentage of single-family homes selling within 60 days drops noticeably below 70%, it will signal that buyer hesitation is deepening beyond normal seasonal trends.
- Price Reduction Trends: Monitoring whether the current 42.4% price reduction share expands will reveal whether sellers are aligning with current borrowing conditions.
- Condo and Townhome Price Stabilization: Watching whether the attached median establishes a firm floor above $290,000 or continues its contraction from peak levels.
Frequently Asked Questions About the Las Vegas Housing Market
What was the median Las Vegas home price in September 2026?
According to Las Vegas REALTORS® (LVR), the median price of existing single-family homes sold across Southern Nevada in September 2026 was $470,000. That figure is down 1.1% from August ($475,000) and unchanged (0.0%) compared to September 2025. The median price for attached condominiums and townhomes was $290,000, down 3.3% month over month and 1.4% year over year.
Are Las Vegas home prices dropping?
Detached single-family home prices have eased slightly from their seasonal highs but remain flat on an annual basis. The September 2026 median price of $470,000 is 4.08% below the record peak of $490,000 set in May and June 2026. Condos and townhomes have experienced more sustained contraction, falling 7.94% from their peak of $315,000 reached in October 2024.
How many homes were available for sale in Southern Nevada?
At the end of September 2026, there were 7,995 single-family homes listed for sale without pending offers across Southern Nevada, according to LVR. This reflects a 5.3% increase from August and a 6.6% increase compared to September 2025. Attached inventory stood at 2,796 condos and townhomes without offers, up 7.3% year over year.
Is Las Vegas currently a buyer's market?
Las Vegas is currently characterized as a balanced market rather than an outright buyer's market. With single-family housing supply standing at 5.0 months, the extreme leverage sellers held in recent years has dissipated. Buyers enjoy more inventory, greater negotiating flexibility, and fewer bidding wars, but prices have held steady rather than dropping significantly.
Why are Las Vegas home sales slowing?
Southern Nevada resale volume is slowing primarily due to borrowing friction. With benchmark 30-year fixed mortgage rates surpassing 7.2% in early October 2026, monthly debt service has increased substantially, limiting the mortgage amounts local buyers can qualify for. Total closed resale transactions fell 3.7% month over month in September to 2,169 units.
How common are price reductions in Las Vegas?
Price cuts have become standard practice for listings that enter the market above buyer expectations. Secondary regional MLS tracking indicates that approximately 42.4% of active Valley listings had undergone at least one price reduction as of late September 2026, with a median reduction of approximately $20,000.
Is the Las Vegas housing market heading toward a crash?
Verified market data does not support the idea of an impending housing crash. Distressed sales (short sales and foreclosures) accounted for only 1.1% of all September resale transactions, compared to more than 60% during the 2008 downturn. In addition, 23.5% of September transactions were completed in cash, and substantial homeowner equity continues to provide systemic stability.
How are mortgage rates affecting Las Vegas buyers?
Benchmark rates above 7% have significantly increased monthly carrying costs. On a median-priced $470,000 single-family home with a 20% down payment ($376,000 loan balance), a benchmark rate of 7.28% requires a monthly principal and interest payment of $2,572.64. That is $303.81 per month higher than the payment on the same loan at January 2026's benchmark rate of 6.06%.
Curious how these market changes could affect your own Las Vegas move? The answer depends on your property type, price range, financing structure, and personal timeline. Reviewing the latest local data alongside your specific situation can help you make a more informed, confident decision.
About the Author
Gavin Brenkus | Lead Agent & Director of Lead Generation
A three-time recipient of the prestigious "Who's Who Under 40" award from Las Vegas REALTORS®, Gavin Brenkus has firmly established himself as one of the most accomplished real estate professionals in Southern Nevada. As a Lead Agent and the Director of Lead Generation for The Brenkus Team, he is an integral part of a family-owned legacy that has achieved nearly $2 billion in sales volume and successfully closed over 8,000 transactions.
For Gavin, real estate is more than a profession—it's a lifelong passion. Immersed in the industry from the age of 16 and licensed before graduating high school, he offers a rare depth of market knowledge that combines youthful energy with decades of absorbed expertise.
His professional philosophy is built on a foundation of listening. Gavin is dedicated to fully understanding the unique wants and concerns of his clients, allowing him to curate a tailored and seamless experience from start to finish. This client-first approach ensures that everyone he works with feels heard, valued, and expertly guided.


Brenkus Team
| The Brenkus Team | Keller Williams Realty The Marketplace
or another way